Kilauea Volcano Lava Eruption Map
Kīlauea lower East Rift Zone lava flows and fissures, June 13, 10:00 a.m. HST
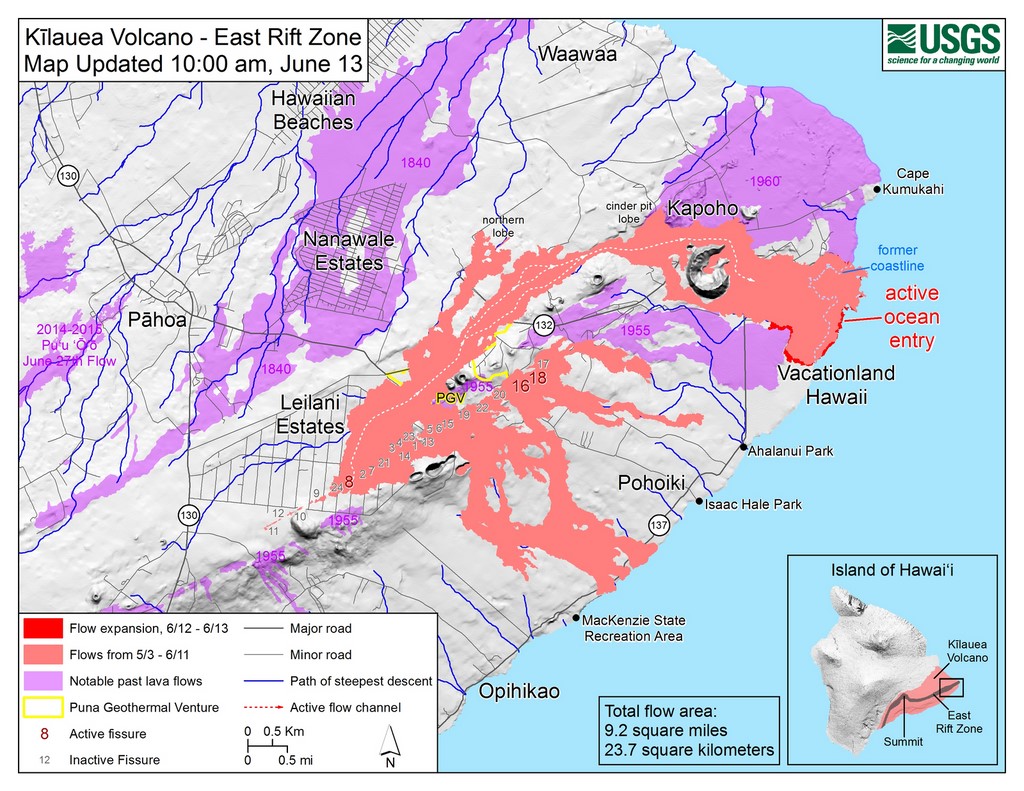
Map as of 10:00 a.m. HST, June 13, 2018. Given the dynamic nature of Kīlauea's lower East Rift Zone eruption, with changing vent locations, fissures starting and stopping, and varying rates of lava effusion, map details shown here are accurate as of the date/time noted. Shaded purple areas indicate lava flows erupted in 1840, 1955, 1960, and 2014-2015. (Map Courtesy USGS)
June 12, 2018Thermal map of fissure system and lava flows
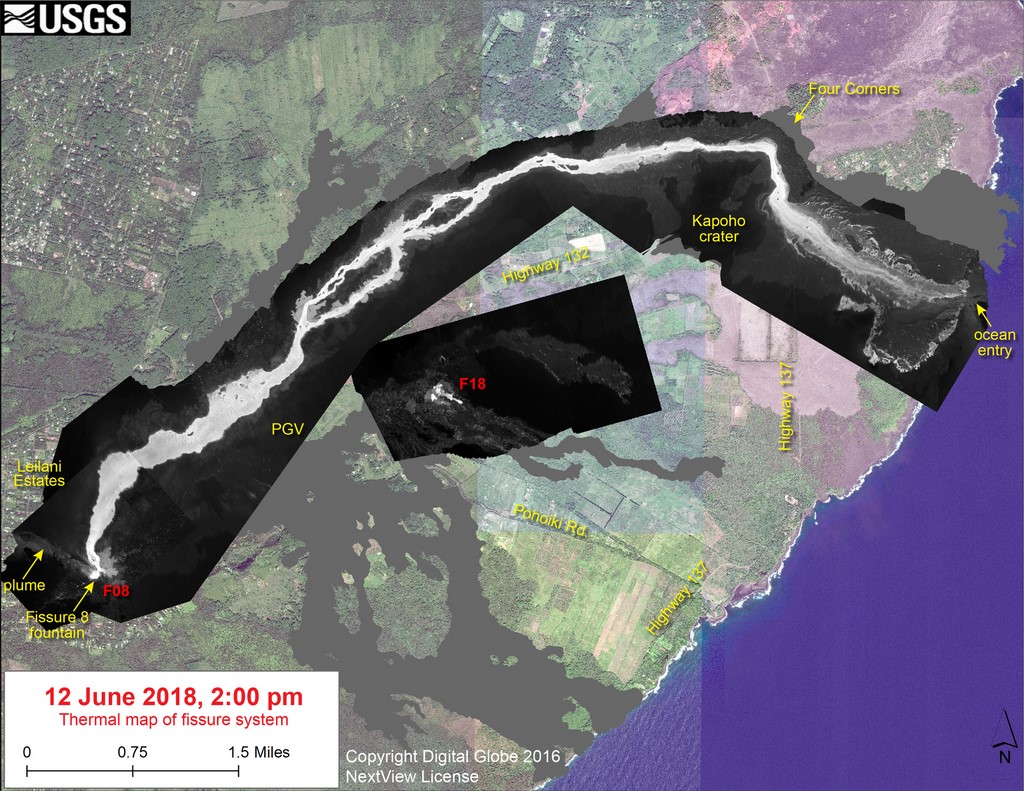
This thermal map shows the fissure system and lava flows as of 2 pm on Tuesday, June 12. The fountain at Fissure 8 remains active, with the lava flow entering the ocean at Kapoho. Very small, weak lava flows have been active recently near the Fissure 18 area. The black and white area is the extent of the thermal map. Temperature in the thermal image is displayed as gray-scale values, with the brightest pixels indicating the hottest areas. The thermal map was constructed by stitching many overlapping oblique thermal images collected by a handheld thermal camera during a helicopter overflight of the flow field. (Map Courtesy USGS)